Hello,
I think I found another case where a graphical parameter is not properly captured. This time the problem occurs with 3D histograms.
Reproducible example:
library(plot3D)
library(gridGraphics)

pfun <- function() {
  hist3D(x = 1:5, y = 1:4, z = VADeaths,
         bty = "b2", phi = 20,  theta = -65,
         col = "#56B4E9", border = "gray30", shade = 0.2,
         space = .3, d = 2
  )
}
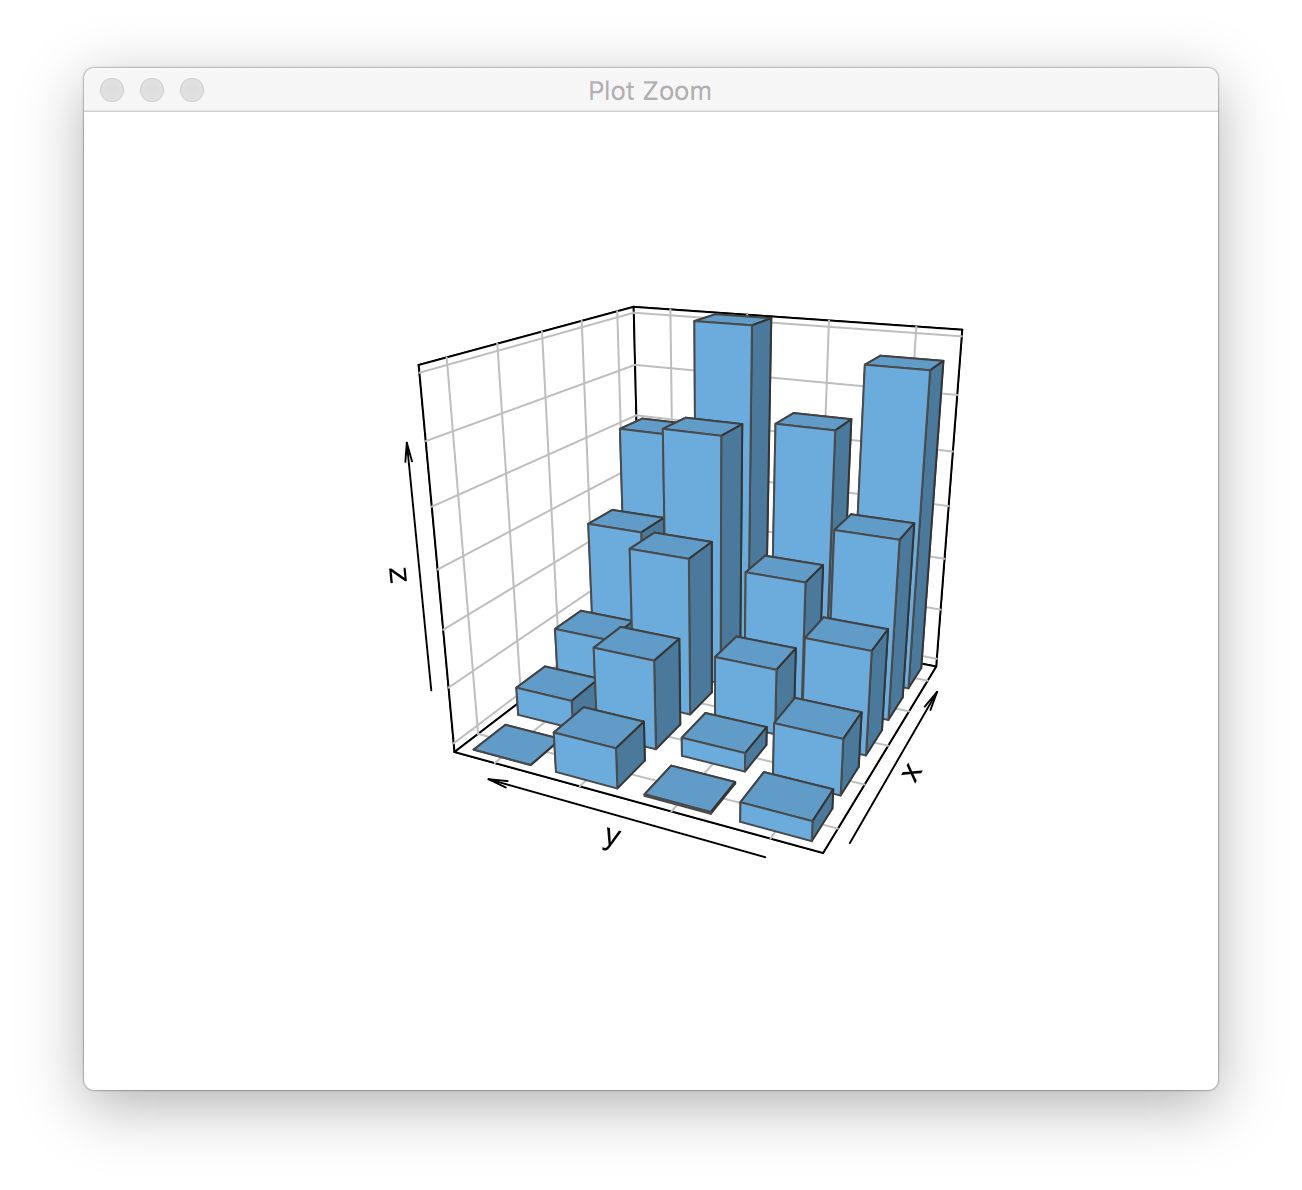
If we execute pfun(), we get the following result:
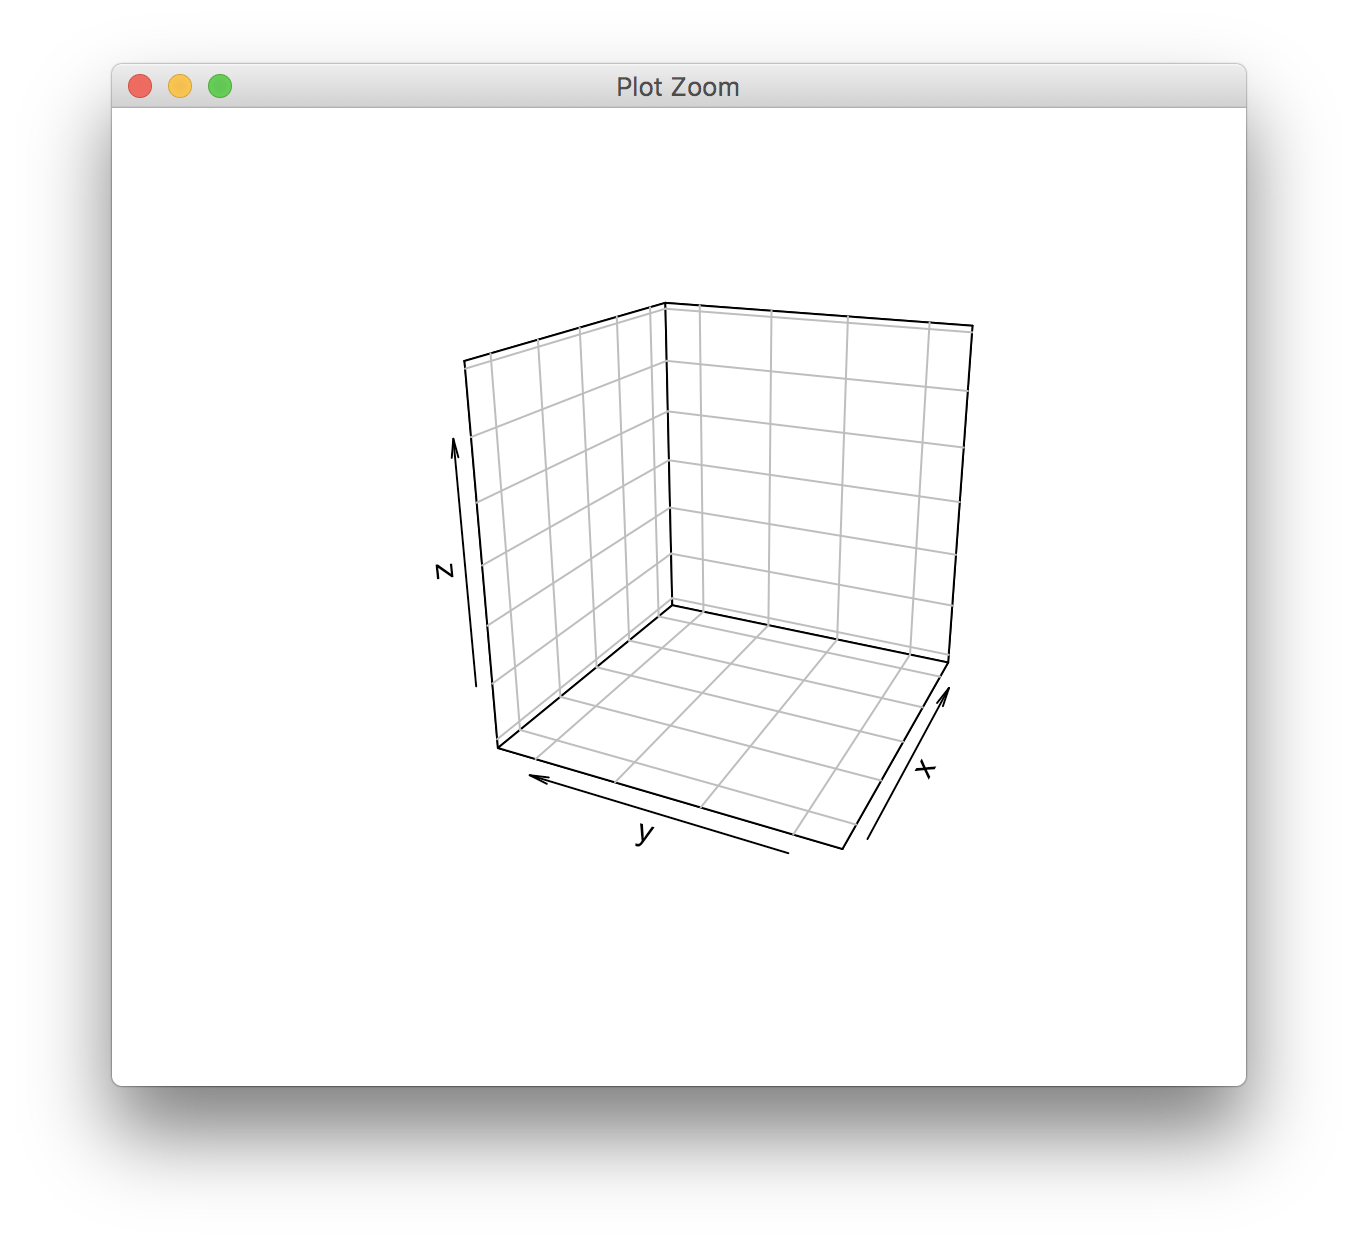
If we try to grid.echo() the same plot, we get the following:
> grid.echo(pfun)
Error in par(inlinePars) : graphical parameter "lwd" has the wrong length
The lwd parameter is used to draw the edges of the 3D bars.
Hello,
I think I found another case where a graphical parameter is not properly captured. This time the problem occurs with 3D histograms.
Reproducible example:
If we execute
pfun(), we get the following result:If we try to
grid.echo()the same plot, we get the following:The
lwdparameter is used to draw the edges of the 3D bars.