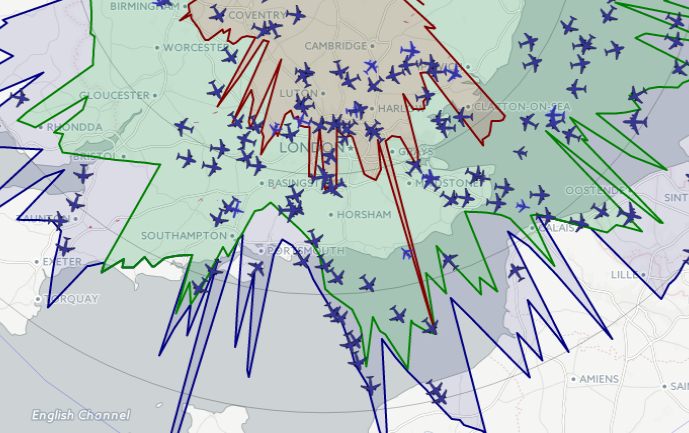
8. Maximum range plot
This modification provides maximum range plot similar to that available with the google maps version of dump1090 and VRS. I've also added the option to select one/any of the max, mid or min current range splats. Note that these should be read as being related to the corresponding height settings in the config.js file.
e.g.
- config.js has: MinRangeHeight = 2000;
- the 'min range' option then plots the 'maximum range of aircraft seen at (up to) 2000 feet'
Files amended:
- script.js - define a new set of features (MaxRangeFeatures) - (ref: AK8A)
- script.js - define variables - (ref: AK8B)
- script.js - option to use either sessionStorage or localStorage for range storage between browser sessions
- script.js - initialise variable in function initialize - (ref: AK8C)
- script.js - define new layer for max range - (ref: AK8D)
- script.js - Display range plot - (ref: AK8E)
- planeObject.js - Define per plane variables - (ref: AK8F)
- planeObject.js - Store per plane variables (bearing and NM) - (ref: AK8G)
- planeObject.js - Store max distances (per bearing: NM, lat, lon, icao) - (ref: AK8H)
- planeObject.js - New functions - (ref: AK8I)
- config.js - define ShowMaxRange - (ref AK8J)
- index.html - allow reset of range - (ref: AK8K)